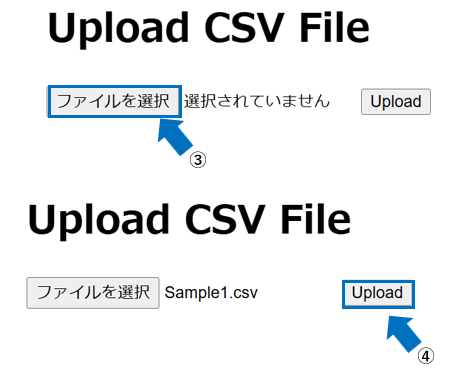
Select the CSV file you prepared.Click Upload.
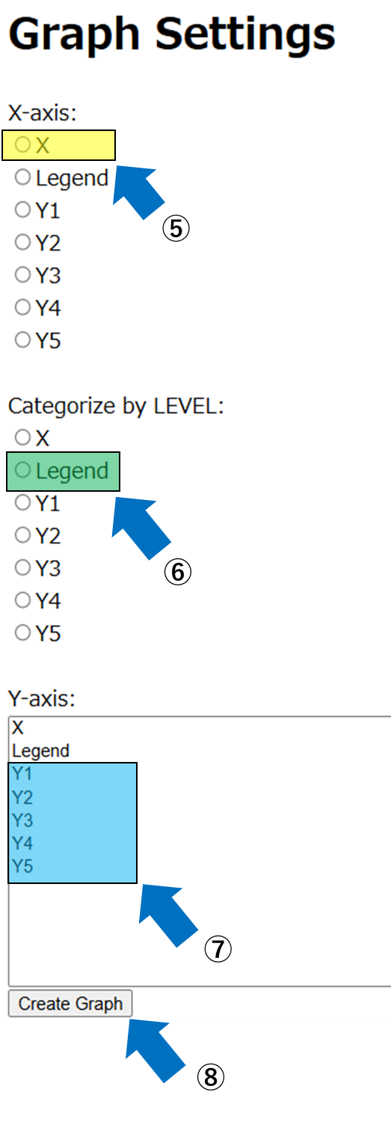
① Select the X-axis ② Select the Legend (optional) ③ Select the Y-axis columns ④ Click Create Graph to generate graphs.